Testing Claude AI's analysis capabilities with Earmark app data
Here's an example of the incredible data analysis you can do with Claude Sonnet 3.7 today.
I uploaded a CSV of course data from the Earmark app and prompted, "Here's a dump of course data from the Earmark app. Please analyze it for me."
That's it—no further instructions.


The CSV file included the following columns:
Earmark ID
Course Title
Channel Name
Field of Study
Published Date
Instructor Names
Registrations
Completions
CPE Credits
Average Rating
Total Ratings
Course Status (Active, Draft, etc)
Next, let's give it a bigger challenge:
"Based on the course titles and channel names, what are the most popular topics for courses? Popularity should be according to registrations."
Here's the result.
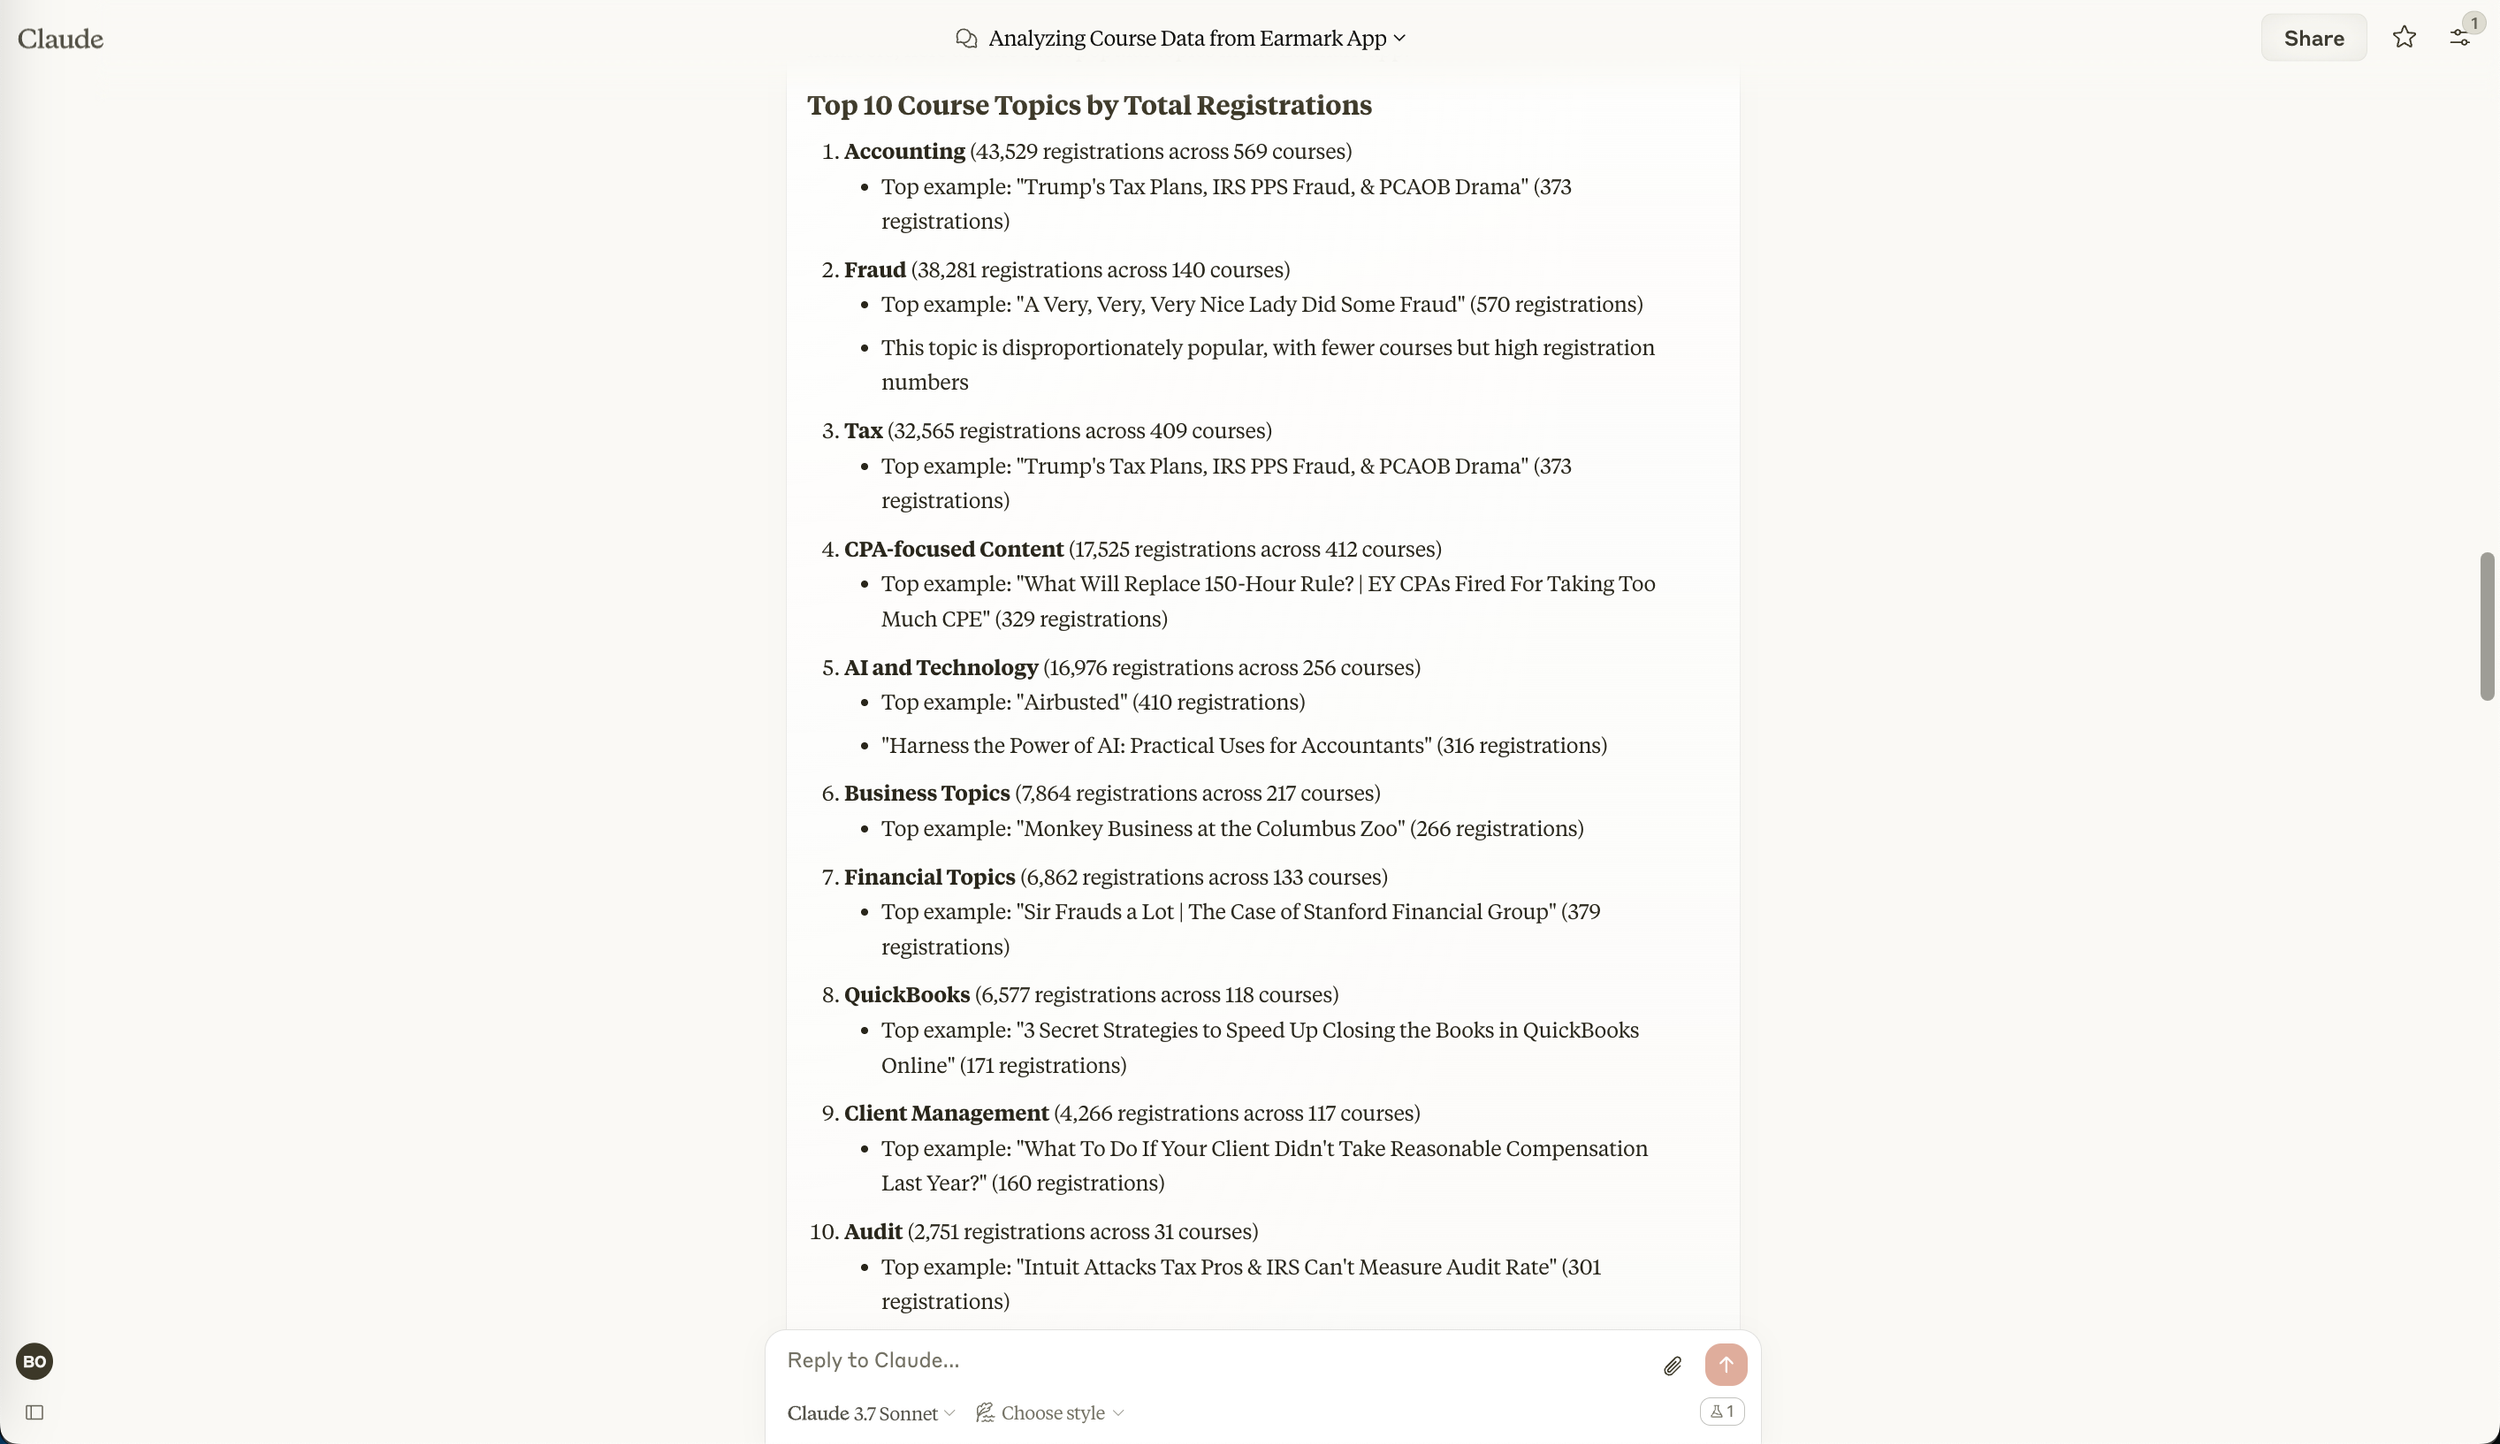
Claude also gave me back a list of key insights on popular content.
All on its own, it goes beyond just making a list of topics using keywords and figures out that:
entertaining titles perform well
case studies are engaging
current events and news topics are popular
AI and technology get strong interest
practical software training about QuickBooks gets lots of registrations
courses about ethics violations do well

Wow.
This would have taken me hours, and I'm not sure how I'd even begin to do this in Excel (or if it's even possible).
How Accurate Is The Analysis?
In case you're wondering about hallucinations, I double-checked some of the numbers, and while they don't exactly match what I calculate in Excel, they're really close.
For instance, Excel sums 130,475 registrations in the sheet and Claude counts 130,642.
That's a 0.001% difference. It's close enough for me to use for my purposes, but it's also a problem if you need the analysis to tie out perfectly.